Beat the Monkey
If simplicity is the key to brilliance, then Tom Tango's Marcel the Monkey Forecasting System (MARCEL) is the shining diamond of MLB player projection models.

READ TIME: ∼3 MINUTES | WORDS: 645The monkey reference (Marcel from Friends) comes from Tango’s intention to build the most basic forecasting system, using as little intelligence as possible.
WHY IT MATTERS
Since MARCEL’s introduction in 2004, player projection systems have become increasingly complicated — yet often aren't much more accurate than Tango's simple approach.
Let's take a step back, return to MARCEL's three-step foundation, and then focus on improving only the lowest-hanging fruit.
Previous Stats: MARCEL takes the player’s results from the last three MLB seasons, then weighs them by recency — last year's stats are multiplied by 5, two years ago by 4, and three years ago by 3
The total for any given stat is then divided by 12 (because 5+4+3 = 12).
Regression Towards the Mean: To account for randomness and varying sample sizes, MARCEL assigns the result from Step 1 a reliability score based on the number of appearances compared to the rest of the league.
The reliability score is then combined with the league average result to give us a regressed prediction for the player.
The more appearances, the higher the reliability score, and the less we need to regress the player to league average.
Age Adjustment: Finally, MARCEL adjusts the stat line produced by the first two steps based on the player’s age since human performance is known to vary based on our age.
For players under 29, increase by 0.006 per year below 29.
For players over 29, decrease by 0.003 per year above 29.
So, can we take MARCEL up a notch without pushing it too far?
BETTER THAN MARCEL
Steps 1 and 3 contain the easiest levers we can pull to improve MARCEL while maintaining the principles of simplicity — as described below for predicting On-base Plus Slugging (OPS).
Step 1 | Previous Stats Upgrade
Using the baseballr package and Baseball Savant's API in R, we can enhance Step 1 of the player’s predicted OPS by factoring in his Statcast swing metrics from the three seasons of concern.
The simplest way to do so is by accounting for his:
Barrel Rate (%) - How often the player hits a ball ≥98 mph with a ∼26-30° launch angle — barrels have led to a minimum .500 batting average and 1.500 slugging percentage, making it a strong gauge for assessing OPS.
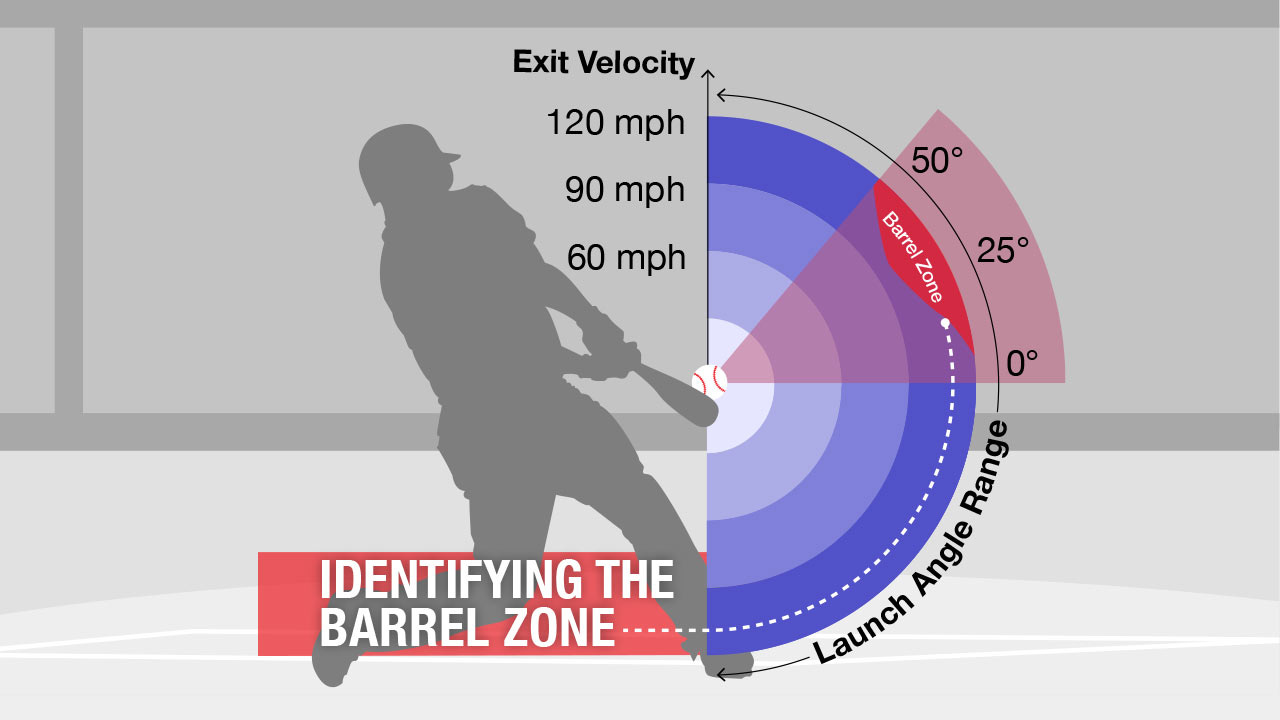
Out of Zone Swing Rate (%) - Tracking Barrels inherently accounts for both the ability to get on-base and slug, so we’ll enhance Step 1 just a bit more with the simplest measure of plate discipline and walk potential — how often the player swings at pitches outside the strike zone.

Step 3 | Age Adjustment Upgrade
We can implement a simple improvement to MARCEL's age adjustment by utilizing the Mixed GAM Computation Vehicle (mgcv) package and gam() function in R.
Tom Tango’s approach to measure player aging and determine the -.0.003 and 0.006 adjustment figures used in MARCEL is called the Delta Method.
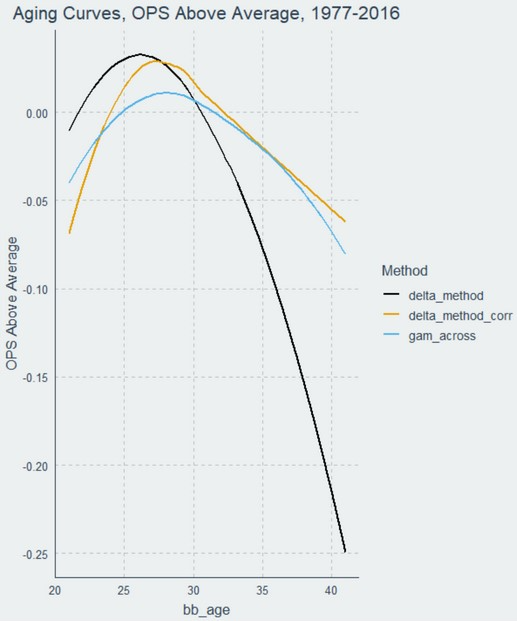
A non-parametric, arithmetic model that projects OPS to follow the curve pictured below as a player ages:

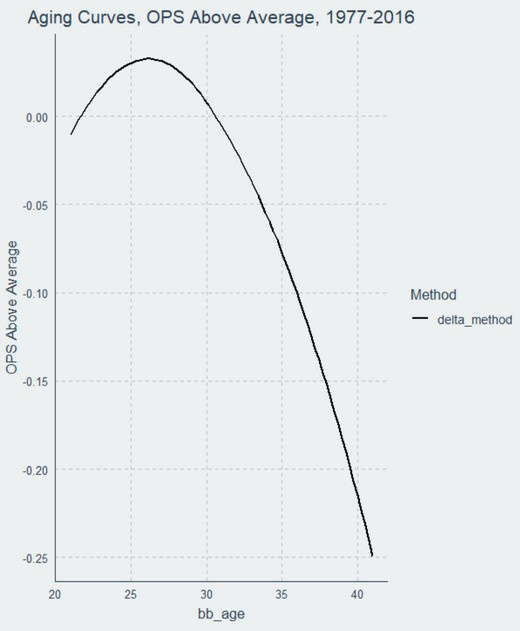
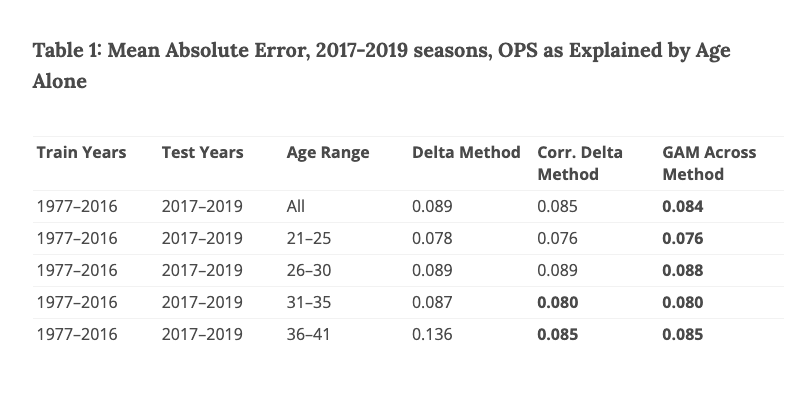
In the years since MARCEL, a semiparametric regression model known as a generalized additive model (GAM) has proven to be an improvement on the Delta Method for projecting the effects of aging on player production.
As rated by Mean Absolute Error — a measure of average difference between forecast and actual.
THE BIG PICTURE
A 14th-century problem-solving principle known as Occam’s razor recommends you search for explanations while using only the smallest possible set of elements.
Tom Tango clearly understood this call to simplicity when he created the Marcel the Monkey Forecasting System (MARCEL) for MLB player projection.
Whether using one of today’s complex forecasting systems or our simple adjustments to his model, you’ll struggle to meaningfully outperform plain-old MARCEL.