
Choose Your Own Adventure, Part II: 2025 MLB Manager Edition
Opening Day is tomorrow. That means no games today. Pass the final day before the 2025 MLB Season by putting yourself in the shoes of an MLB Manager...

READ TIME: ∼8 MINUTES | WORDS: 1,635 In our previous Choose Your Own Adventure, we considered four different perspectives on how an MLB GM may tackle real-world problems using t-tests and ANOVAs (data analytics tests for comparing averages between groups).
Today, we will embark on a similar adventure, but we're moving from the front office to the dugout.
We are now data-driven MLB Managers looking to inform key decisions for tomorrow’s rapidly approaching 2025 season.
Fortunately, analytics such as linear regression allow us to use existing real-world data to identify relationships between variables and predict future outcomes.
WHY IT MATTERS
In our data-driven era, MLB Managers can't rely purely on instincts.
We must utilize all the tools and resources available to us to decode past performance, project future outcomes, and build winning lineups.
➞ Player Projections: Predicting future outcomes based on previous results is a point of strength for linear regression — making it the perfect tool to project a player’s future performance based on stats from previous MLB seasons.
If we want an accurate projection that takes into account the realistic nature of baseball (and life)—things like random chance, unpredictable fluctuations in skill, and age—we can't assume a player will simply copy and paste his past outcomes into the future.
A simple way to think about it: Outcomes = Talent + Randomness*
Thankfully, we can stand on the shoulders of baseball analytics professionals who came before us, like Tom Tango, who found the best way to account for the inherent randomness and unpredictable external factors is with regression towards the mean.
In Tango's The Book, he clarifies that to project a player's future performance, we need to adjust his past performance toward the average performance of similar players, not all players. While this helps us limit the effects of randomness on our projections, we still have things like age and league/park factors to consider

➞ Team Projections: Linear regressions actually fail to predict a team's win-loss record (winning percentage) since a one-unit change in Runs Scored or Runs Allowed does not lead to a consistent (linear) change in winning vs. losing.
Bill James is credited with being the first to recognize the nonlinear nature between runs scored, runs allowed, and wins. Instead, he found that the relationship is best expressed by a math formula similar to one you likely learned as a tween — the Pythagorean expectation.
Though not linear, this formula allows us to predict a team's season win total with just their total runs scored and runs allowed.
So, we can use the linear regression process from our player projections to determine projected runs added (or lost) by a player, then factor that into our team's runs scored/allowed for the Pythagorean expectation, giving us a projected winning percentage for the season.
pythagorean expectation formula:

➞ Aging Curve: Another common analytic technique of interest is projecting the effect of age. Once again, this is a nonlinear relationship since a player's performance does not change at a constant rate over time.
There’s no shortage of debate on the best method for projecting the effect of player aging; nonetheless, it's generally accepted that humans can't physically perform as well at 36 as they can at 26 because they’re more likely to get hurt and perform worse even when they are healthy.
Though no two players age exactly the same way, these consistent trends in aging need to be accounted for to properly project future production.
Below is an aging curve graph for OPS+ from 1988 to 2016 with clear peaks in the mid-20s (showing multiple aging curve methods; click here to read more).
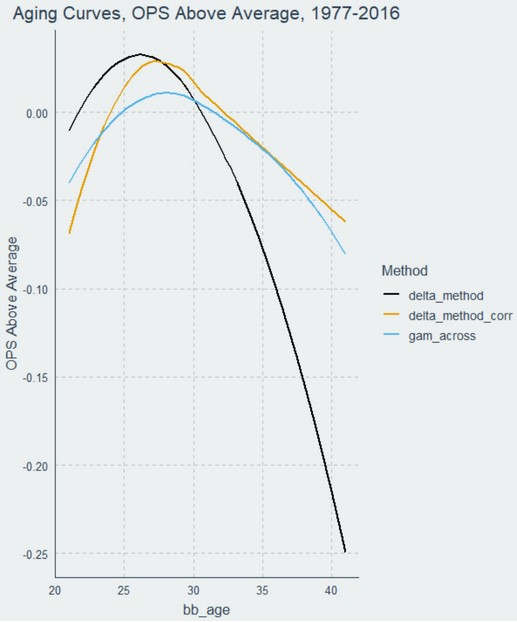
The idea is to use an aging curve to project the effect age has on a player, factor that into our linear regression for player projection, determine projected runs added (or lost) by a player, then factor that into our team's runs scored/allowed for the Pythagorean expectation, giving us a projected winning percentage for the season.
ZOOMING IN
➡︎ Toronto Blue Jays
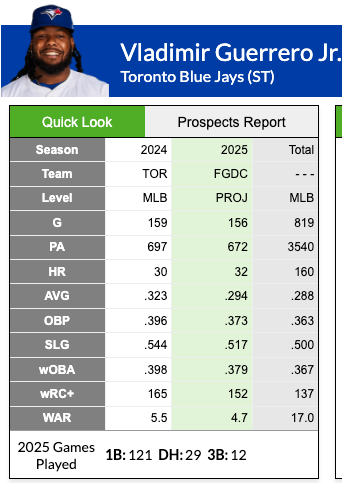
A major storyline this spring training was the reluctance of the Blue Jays to extend their homegrown star, Vladimir Guerrero Jr. It likely comes down to uncertainty about which version of him you can expect — the recent MVP-caliber player, the borderline replacement-level player, or the league-average player from 2022 (see stats here)?
Research Question: What level of production can we expect from Vladdy in 2025?
Prediction Process: Randomness is especially relevant to our Vladdy situation when we zoom out and realize that A) six years of stats is a relatively small sample size, and B) the inconsistency within those six years further muddies things.
Once again, we can lean on those who came before us by using existing, popular, advanced methods of projection (all of which are still linear regressions) such as ZiPS, Steamer, and Depth Charts (amongst others).
Depth Charts is FanGraphs' (FGDC) in-house projection system, an average of ZiPS and Steamer plus a bit of customization for playing time estimates — see Vladdy's 2025 Depth Charts projection in the green column below:

➡︎ Arizona Diamondbacks
One of the prized free agents this past off-season was fantastic starting pitcher Corbin Burnes, whom the D-backs locked in for the next six years with the richest contract in the franchise's history ($210 million).
Between his salary and impressive stats (see them here), one might think it's obvious as to who is the club's ace — but let's not forget the outstanding pitcher who's been the head of our pitching staff for the last 6 seasons, Zac Gallen (see stats here).
We can't let ephemeral factors like who makes more money sway our decision as an analytically minded Manager.
Research Question: Will Burnes or Gallen, as our number one starter, lead to more team wins in 2025?
Prediction Process: Building on the player projection process, with a bit of extra work from our analytics team, we can project both pitchers' 2025 total runs allowed using the anticipated matchups of our ace.
The two separate scenarios will likely provide us with different total runs allowed for our ace matchups. We then plug these into two separate Pythagorean expectations to compare possible 2025 winning percentages.

➡︎ Pittsburgh Pirates
It's been a while since Pirates fans had a ball club to get excited about, but things seem to be improving in recent years as young, exciting, uber-talented ballplayers make the big team — Exhibit A) Oneil Cruz.
Though his talent is undeniable, questions remain about how to get the most out of the budding star, as shown by our decision to move him from shortstop to center field for the last 23 games of the 2024 season and the 2025 season.
Research Question: What effect will Cruz's position change have on his value in 2025?
Prediction Process: Positional adjustment is an essential part of player evaluation (and comparison) that we have yet to discuss. In short, it would be foolish to compare the defensive value of a shortstop to that of a right fielder because they field a totally different kind of batted ball at a totally different rate.
So, we correct for the inherent difficulty of playing some positions compared to others, adding runs for players at more demanding positions while subtracting runs for players at easier positions.
The shortstop adjustment is +7.5 runs per full season, while the right field adjustment is -7.5 runs per full season — see FanGraph's full positional adjustment chart below:

➡︎ Kansas City Royals
The Royals are an exciting, up-and-coming team in the big leagues, largely thanks to their 24-year-old phenom shortstop, Bobby Witt Jr., who seemingly has no ceiling as he inches closer to the title of undisputed best player in the game.
Witt Jr. and the Royals' long-term future seems bright (2024-2034, 11 years, $288.778M), but the fact remains that the backbone of our team is Salvador Perez — as has been the case for the last 13 years (see stats here).
His longevity, consistency, and offensive production as a catcher are nearly unprecedented. But as we enter his age-35 season, it's our duty as the Manager to always consider what's in the best interest of the team, not any one player.
Thus, we can’t assume Salvy will be the first person in history to defeat Father Time.
Research Question: Could Salvy's age start to impact his value to the club in 2025?
Prediction Process: More straightforward than our D-backs and Buccos processes, we're simply looking to apply our preferred aging curve method to Salvy's MLB body of work (and regression toward the mean) to get an idea of how many runs and wins Salvy projects to add to the team despite moving into the age seasons often hallmarked by rapid decline.
You should notice that this is essentially just the player projection process described earlier. In fact, all of the previously noted popular player projection models (see Blue Jays section) apply their own methodology to account for the effects of age.
Our in-house analytics department likely has a proprietary preferred method for projecting the aging curve for Royals players. But, as the Manager, we have to weigh not only the tangibles but also the intangibles of Salvy as a leader and irreplaceable presence in our clubhouse culture.

THE BIG PICTURE
Similar to our MLB GM perspective, relying solely on the guesswork and instincts of "baseball lifers" is a relic of the past.
Managers today must include analytics in their decision-making toolbox, ignoring the power of something like linear regression and its ability to predict future outcomes will likely come with significant losses.
Happy Opening Day tomorrow — here’s to a great 2025 season of baseball!